Navigating the Interface
The primary interface used when working on Instalink projects is called the Graphical Process Modeling (GPM) interface. This interface includes the data flow listings, the data flow editor, and action editor forms.
Interface Overview
When loading a project the user is presented with a listing of the project's data flows. Here is an overview of the main sections of the interface.
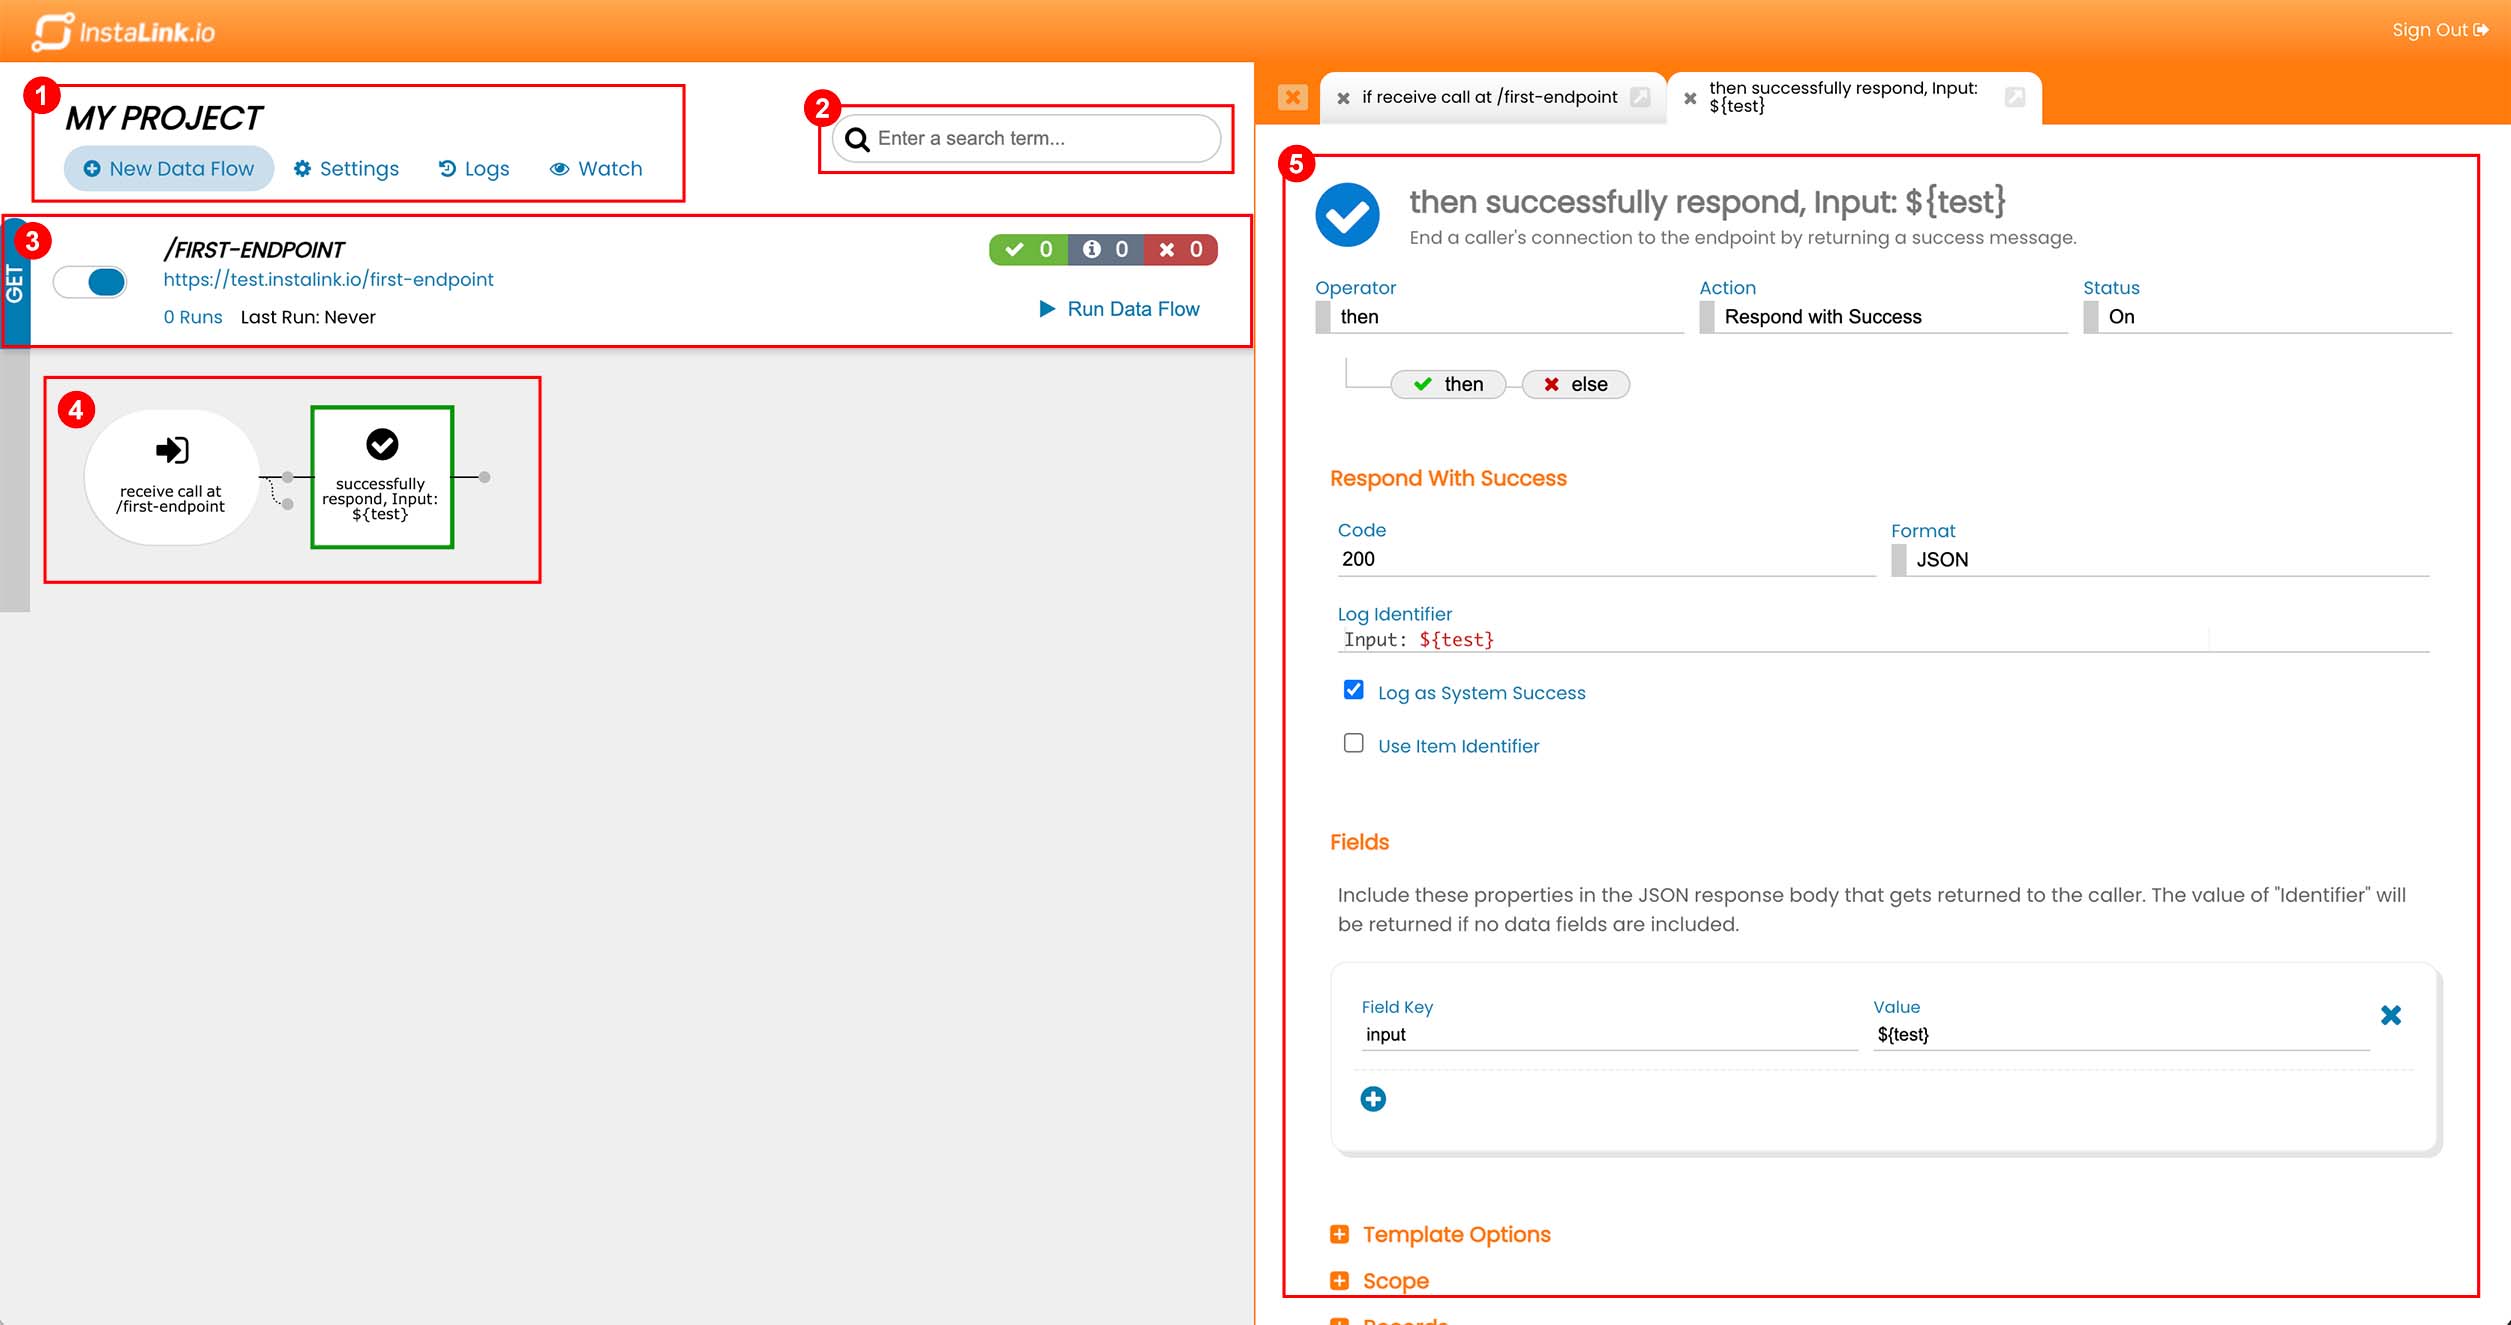
- Project Menu
This menu includes the project's name, a prominent "New Data Flow" button, and a link to access the project settings. There are also links to view request logs for the project as well as a link to watch live requests being processed by the project. - Action Search Bar
Enter a search term which matches the description of an action in the project. - Data Flow Listing
The data flows are listed in order of their creation. Recent data flows are at the bottom of the list. Click on any listing to toggle the view of the corresponding data flow graph. - Data Flow Graph
Each data flow is represented by a data flow graph. Each action in the chart is shown in the order that the actions will be executed. - Action Editor
The action editor appears in the first tab group on the right side of the screen when an action is selected in the data flow graph.
Tabs
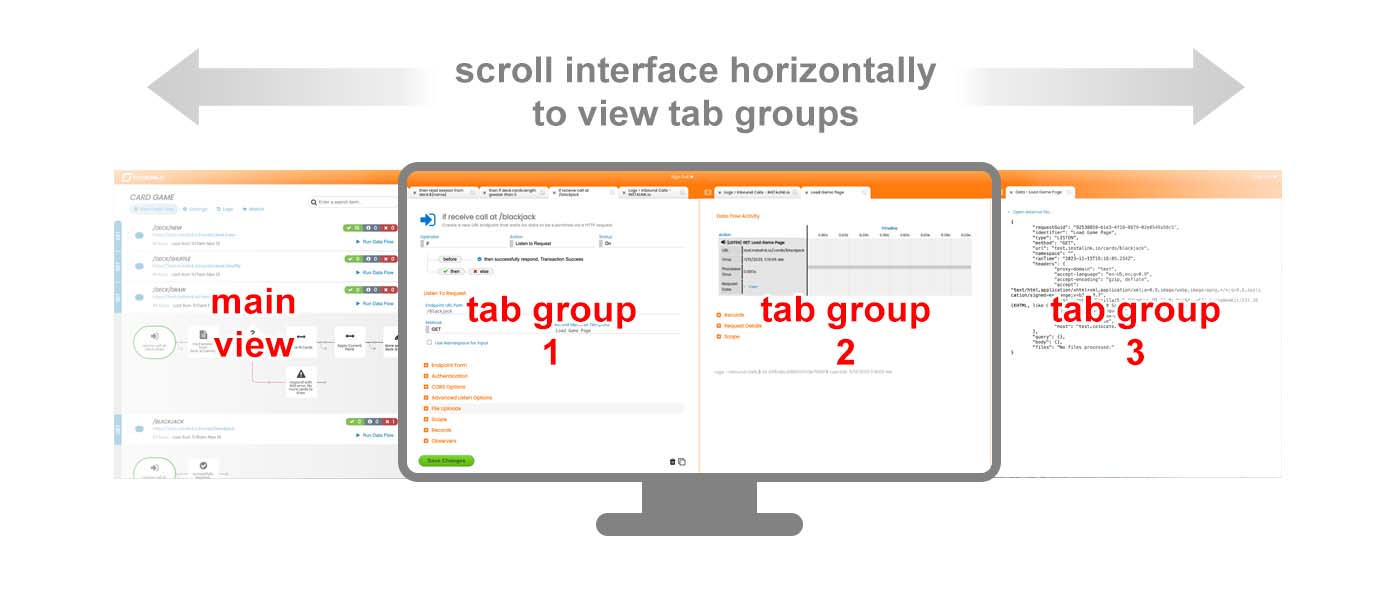
Selecting an action, viewing logs, or loading sub menus within the GPM interface will cause the menu to appear within a new tab on the right side of the interface. The tabs are organized into tab groups. Loading a view from the primary window will cause it to load in the first tab group to the right. Any link within a tabbed view will be loaded into a subsequent tab group further to the right. The entire interface can be scrolled horizontally to reveal additional tab groups.
Using the Tab Bar

- Click on any tab to reveal the corresponding menu. The current state of the menu is always maintained so swapping between tabs will not cause the forms to be reset.
- Press the gray "X" on each tab to close the tab. Closing the tab will cause any unsaved changes to the menu to be lost.
- Press the light gray arrow icon on a tab to open that view in a new browser window.
- Press the white "X" to close the entire tab group. Any unsaved changes in the contained tabs will be lost.
- Scroll the tab bar horizontally to reveal additional tabs that are in the tab group.
Data Flow Listing
Each data flow in the project is listed in the main view of the GPM interface. This listing contains various high-level details, links, and actions that can be performed on the data flow.
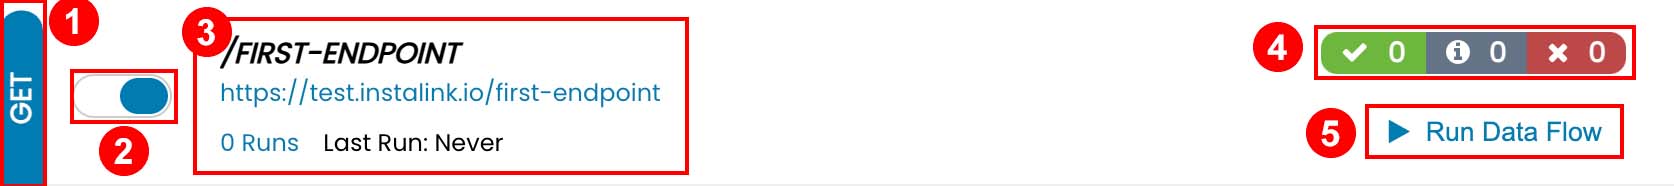
- This label quickly identifies the type or method of the IF operator's action. This can be any of the standard HTTP request methods, "CRON" for scheduled tasks, or "ACTION" for connector actions.
- Use this toggle to quickly disable or enable the data flow. This action sets the IF operator's action status to ON or OFF.
- The name of the data flow, or the base path of the listener is prominently displayed. This label is derived from the IF operator's action (the first action in the data flow). The URL of where the endpoint is listening is shown directly under the data flow title. Use this URL to call the endpoint from external sources. Finally, the total number of times that the data flow has ever been run is displayed in a link. Click on the link to navigate to the inbound request logs for this data flow.
- Shows a running tally of all the success logs (green), informational logs (gray), and error logs (red) that have been recorded on the data flow. Click on any of these numbers to navigate to the success, informational, or error logs for the data flow.
- Use the "Run Data Flow" button to manually execute the data flow within the Instalink interface.
Click anywhere on the data flow listing to reveal or hide the associated data flow graph.
Data Flow Graph
Actions in the data flow are represented in the data flow graph. The actions are show in order from left to right in the order which they will be executed. See The Basics for more information on how data flows work.
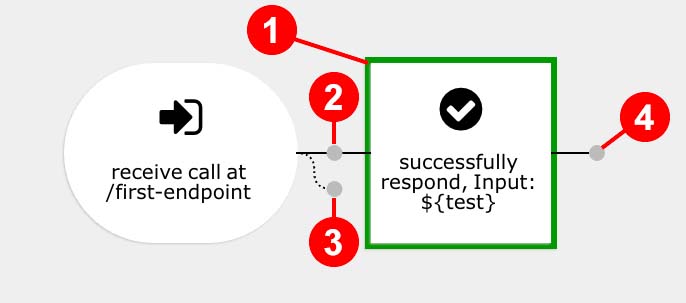
- Click on an action node to select it. The action editor for the selected action will appear in the first tab group on the right. Selected actions are highlighted green in the flow graph.
- Click on the small circle on the line between action nodes to create a new action that will execute between the two actions.
- Click on the small circle at the end of the dotted line after an action node to create a new execution branch that will run in parallel to the other children actions.
- Click on the small circle at the end of the line of the last action in a branch to create a new action that will run after all previous actions have been processed.