Viewing Data Flow Logs
Data logs are recorded automatically every time a data flow is run on Instalink. These logs are known as the "inbound request" logs. They store basic information about the date and time the data flow was run, how long it took the data flow to complete, and what data was submitted to the data flow. The inbound request record also contains details about any events that were tracked during the course of the data flow's execution. As such, the inbound request logs should be the first records to review when inspecting or debugging a running data flow.
Accessing Inbound Request Logs
There are multiple ways to access inbound request logs. Open the GPM interface and scroll to the data flow that needs to be inspected and click on the "# Runs" link to view the inbound request records for that data flow.
The inbound request records for an entire project can be found by clicking the "Logs" link from the project settings section of the GPM interface.
The "Records" sub-menu of IF operation actions (the first action in the data flow) will also have a link to "View Inbound Requests".
The 50 most recent logs are displayed by default. The logs can be further filtered to view specific records or specific run times. Click on the light gray arrow icon in the tab bar to view the inbound request records in full screen. Viewing the logs in full screen reveals the filtering menu on the sidebar. Enter a search term to find specific records. The record identifier text is used for the search.
It is important to always include a record identifier on your logs so that individual records can be
easily found. Be sure to use the template syntax to include something identifiable such as a record number, or a
transaction id. For example New Order: ${orderNumber}.
It is best practice to narrow down the record results to a known time range. This makes it easier to find certain records out of large data sets. For example, if it is now Wednesday and it is known that an issue with a data flow occurred sometime on Monday morning, then use the date range selector to narrow down the logs returned. Search can also be applied to the time frame to return even more specific results. Follow this process where possible to ensure that only relevant data is being inspected.
Reading the Inbound Request Log Table
The inbound request log table provides several metrics that are useful for inspecting the behavior of processes at-a-glance. This information can be used to locate specific records, or determine if there are any issues with a running process.
- Label
Shows the record log identifier. This is intended to be used to quickly identify specific records in the listings. - URL
The internet location that was called to trigger the running of the data flow process. - Time
The date and time when the data flow execution began. - Request Data
A direct link to view the raw data that was submitted to the inbound request. - Item Count
LISTEN actions have an optional feature that will count the number of values in a list and store it on the inbound request record. This is useful to determine the approximate size of the request or the number of records contained in the inbound data that were requested to be processed. - Stats
A summation of all the occurrences of success logs, informational logs, or error log events that occurred during the processing of the data flow. This is useful for determining at-a-glance whether the process completed all tasks successfully. - Stats
A summation of all the occurrences of success logs, informational logs, or error log events that occurred during the processing of the data flow. This is useful for determining at-a-glance whether the process completed all tasks successfully. - Progress
Data flows that include progress tracking actions will show a progress bar here. This is useful for determining how close a long-running data flow is to completion. - Time Elapsed
Shows (in seconds) the amount of time that has past from when the data flow began processing to the time when it completed processing. This will show the amount of time from the start to the current time if the data flow is still in progress.
Clicking on any record in the table will load the full inbound record.
Reading the Inbound Request Record
The inbound request record contains all events that occurred during the processing of the data flow. This includes the initial trigger action, any time data is sent to an external service, and all other logs included in the data flow.
The main section of the inbound request record is "Data Flow Activity". This is a timeline of all activities that occurred during the data flow process. All logged actions are listed in ascending order of execution with the initial LISTEN or CRON action being first. The timeline shows the relative timing of when each action occurred during processing as well as how long each action took to complete. Error log actions are listed in red while success log actions are listed in green.
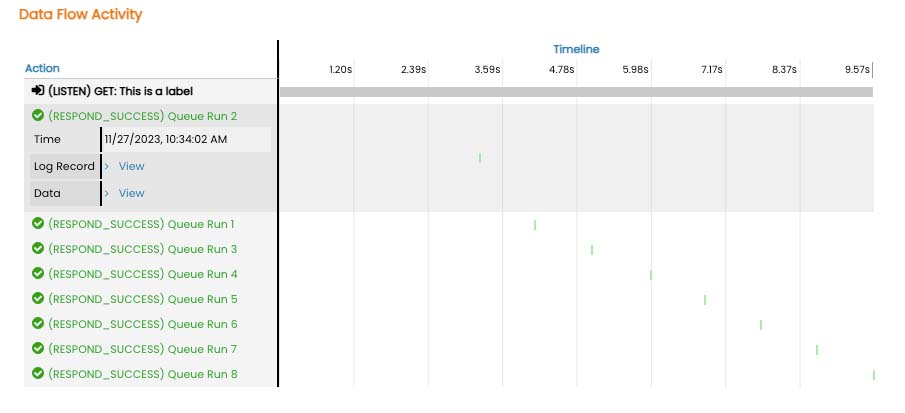
Clicking on any action label will expand the view and reveal more details about that action. The details include exact timing, processor execution time, and links to data stored on the action.